

Home / Solutions
One control base,
into a different process every time
A chiller plant is, at heart, a single idea: meet the load with the best combination of equipment and parameters. Abstract that idea, add digital modelling and simulation, and it travels to dehumidification, grain storage and heat pumps — anywhere temperature and humidity have to be held.

01 Proven / HVAC
Central HVAC and plant rooms
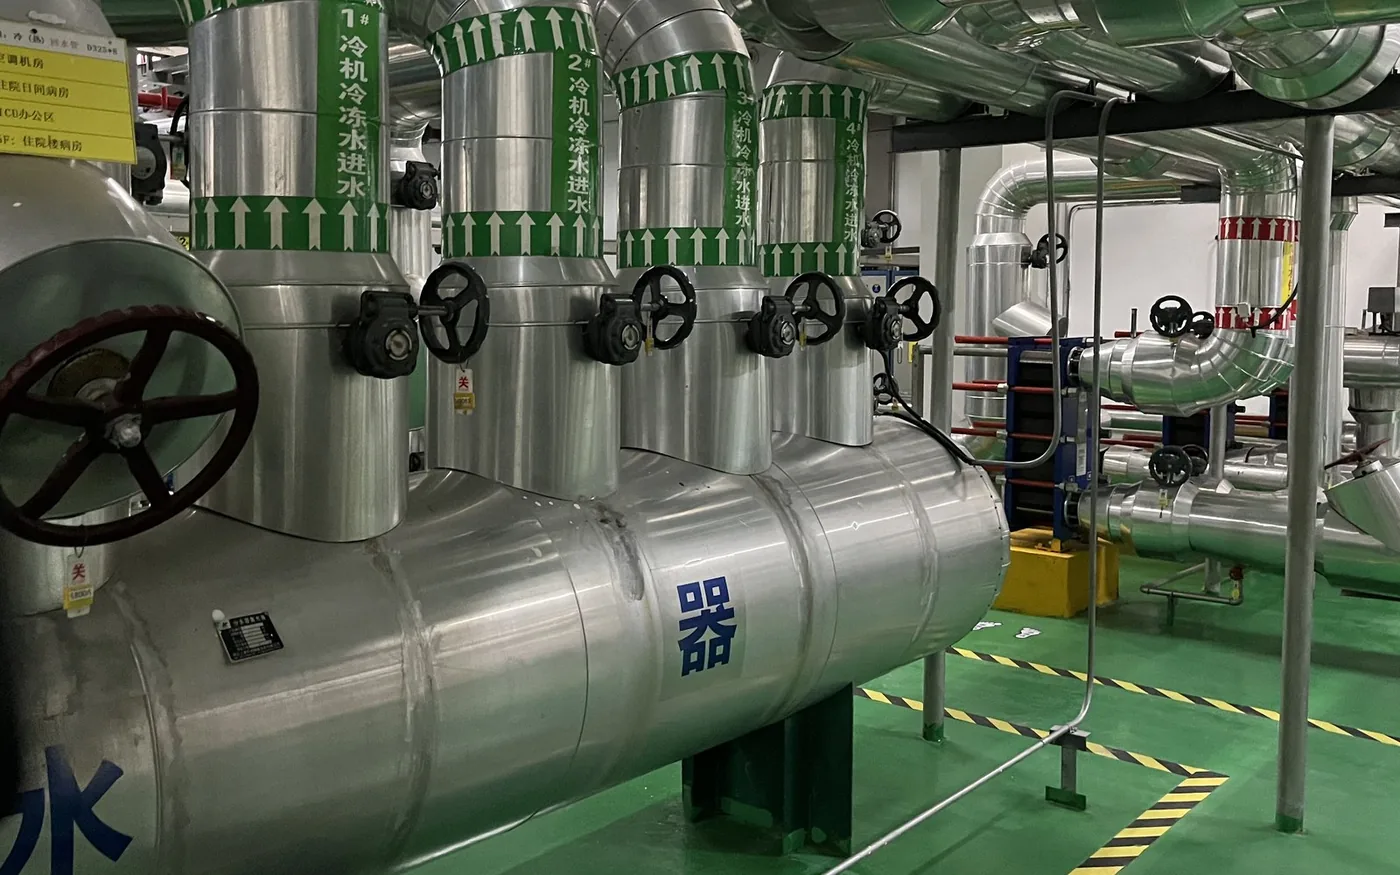
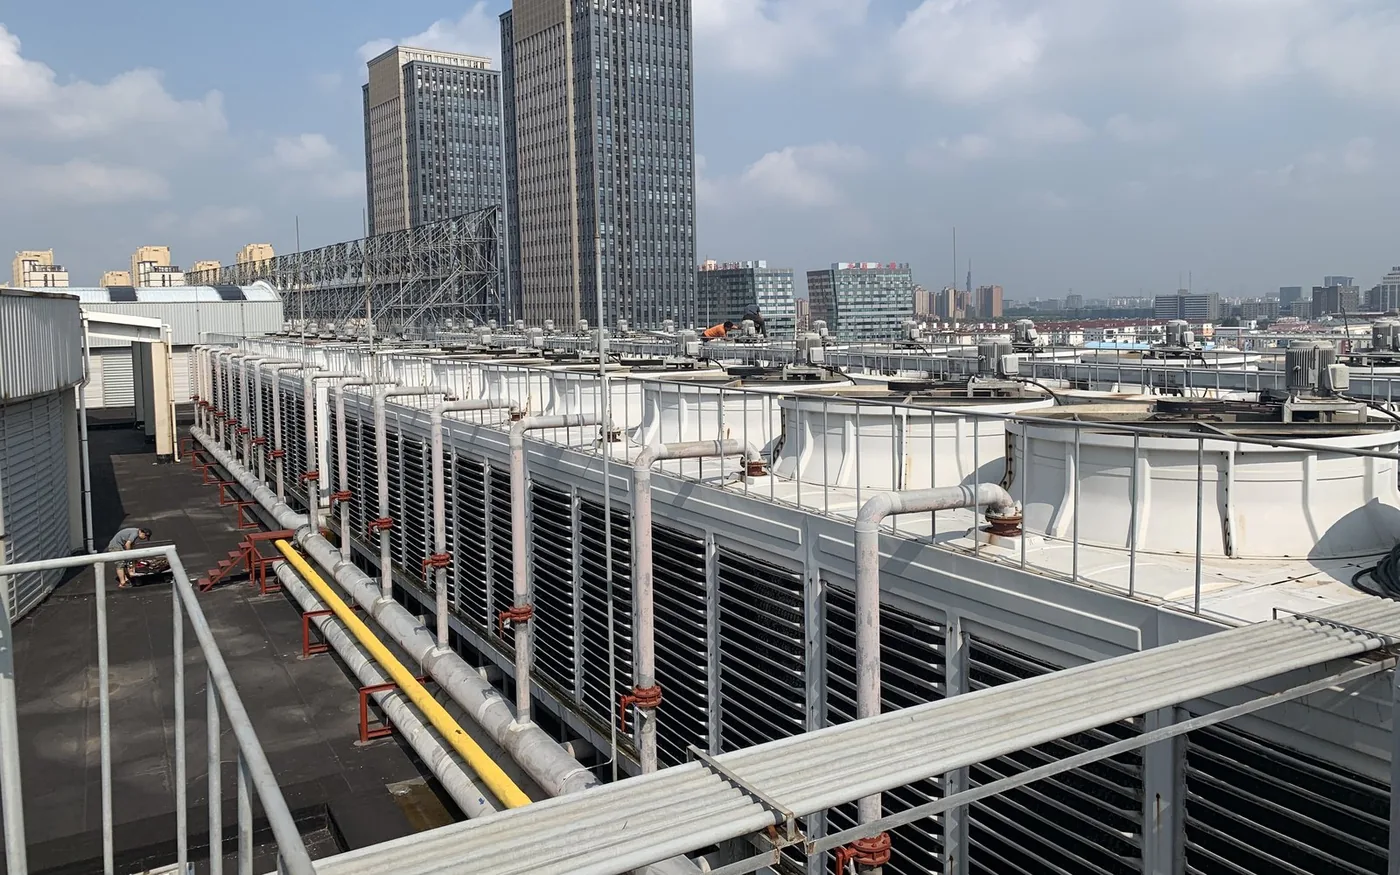
Primary, secondary and tertiary pump networks — we have done all three. From two BAS systems each minding its own corner to one organism: chillers, boilers, chilled and cooling-water pumps, cooling towers, heat-exchange stations and terminals optimised together against live load.
- System integration — several BAS brought onto one platform, existing controllers kept, nothing torn out.
- Hardware reinforcement — VFDs and sensors added to pumps and towers where they are needed, so the equipment becomes adjustable.
- Algorithm upgrade — pump VFDs driven by pipe characteristics, chilled-water temperature floating on outdoor temperature, tower approach controlled on wet-bulb, plus AI models that keep learning.
- Verifiable — saving rate measured by similar-day comparison, delivered with an energy-saving test report.
Measured results
Ningbo Airport T2: plant EER 3.0 → 4.1, 1.17 GWh saved over a year, a 14.54% saving rate. Raffles City Ningbo: EER 3.0 → 4.4, 20.3% in summer. Zhaoxiang Yangtze River Delta Tech Park: 28%.
| Typical sites | Transport hubs, retail complexes, offices, campuses, hospitals, factory plant rooms |
|---|---|
| System scope | Chillers / boilers / chilled-water pumps / cooling-water pumps / cooling towers / heat-exchange stations / terminals |
| Control brands | Siemens, Johnson Controls, Midea KONG-NZ and other mainstream BAS and supervisory systems |
| Product set | Box Governor or Box Optima + Nexus where there are several sites |
| Timeline | Diagnosis 2 weeks · design 2–4 weeks · retrofit and commissioning 8–12 weeks |
| Verification | GB/T 31349-2014 similar-day comparison · energy-saving test report |


| Typical sites | Cell coating, desiccant-rotor dehumidification workshops, humidity-sensitive precision manufacturing |
|---|---|
| Pain points | Over-drying, high regeneration energy, process demand disconnected from equipment output |
| Product set | Tap DH terminal (+ on-site sensors and controller integration) |
| Model form | Lightweight DCCS · CSV lookup models |
| Measured | About 20% less dehumidification energy in a production-line demo |
| Next | Industrial vertical large models + multi-system coordinated dispatch |
02 Delivered / Dehumidification
Industrial dehumidification and humidity-controlled workshops
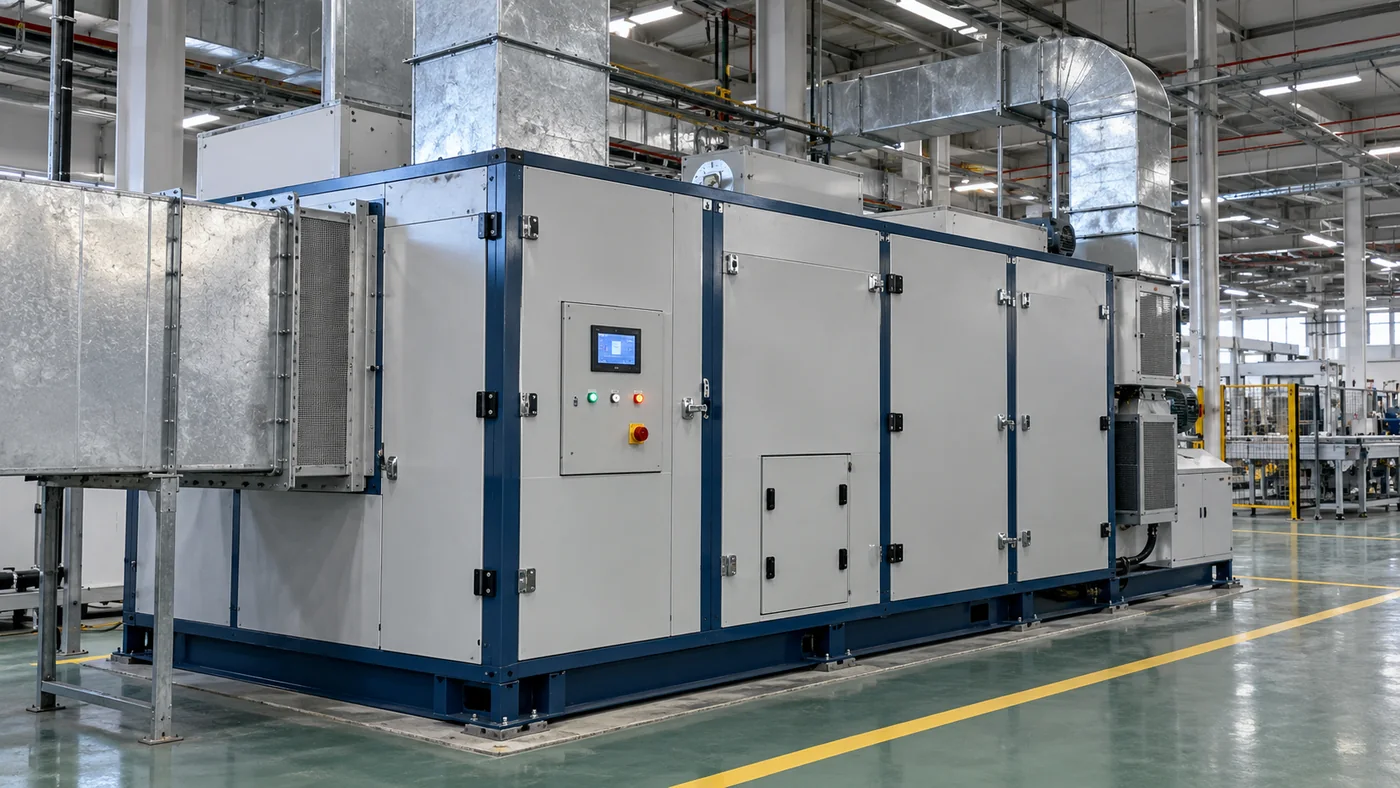
Dehumidifier logic has run on fixed parameters for far too long: line running or stopped, outdoor air wet or dry, the rotor and the regeneration heater work flat out. Tap DH does something specific — work out how much supply-air humidity is actually needed right now, then decide how the equipment should run.
- Humidity by process demand — separate windows for line running and line stopped, and for each process step, so there is no all-day over-drying.
- Regeneration energy — regeneration heat is the largest energy item in a dehumidification system; feed it on demand instead of at a constant rate.
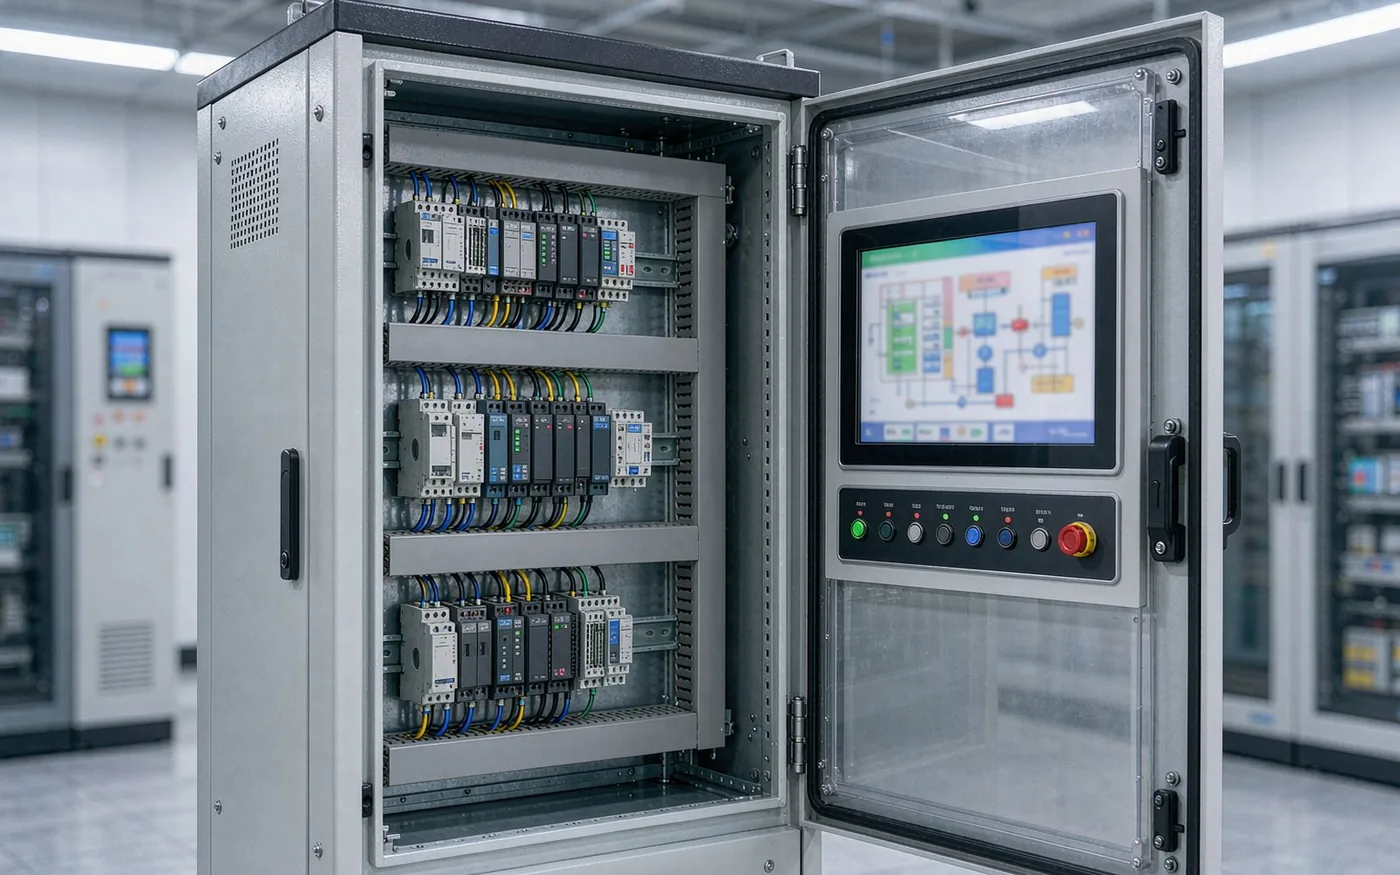
- On-site closed loop — the lightweight model runs on the terminal, with no round trip to the cloud, so a weak network does not affect control.
- Extensible — the same base can take on HVAC, chilled water and exhaust systems for multi-system coordination.
Source note
Data from a production-line demo in a cell-coating workshop (27 tests planned, 24 completed). Modelled on tail humidity control at the anode coater, one process point alone could cut dehumidification energy by about RMB 18 million a year.
03 Delivered / Granary
Grain condition and cooling in storage
A granary spends its energy on two decisions: when to aerate, and when to cool. Tap GR connects grain-condition monitoring to chiller control — read the temperature, humidity and grain bulk state first, then decide start/stop and operating condition.
- Live grain condition — temperature and humidity from every silo on one platform, replacing manual inspection logs.
- Linked temperature and humidity — chillers and aeration equipment respond to the actual state in the silo, cutting wasted aeration and over-cooling.
- On-site autonomy — the terminal closes the loop locally and keeps running to strategy on an unstable network.
Typical sites
Grain reserves, granary chiller retrofits, and any storage that needs temperature and humidity held.

Site photo © Tongjie Energy, July 2026 — granary chiller AI control project under implementation.
| Scenario | PVT solar thermal, air-source and water-source heat pumps, combined heating and cooling |
|---|---|
| Product set | Tap HP / Tap PVT (proposed suffix) + Nexus Cloud |
| Capability | Output metering, operating strategy, platform monitoring, integration with existing systems |
| Stage | Pilot in progress (Shanghai Jiao Tong University PVT project) |
Method
A new scenario never starts on real equipment: survey and model first, rehearse the strategy on a digital twin, then switch over progressively. That is the precondition for moving chiller-plant algorithms onto solar-thermal systems.
04 Pilot / PVT & Heat Pump
Heat pumps and PVT solar thermal
Solar-thermal and heat-pump output swings with weather, irradiance and water temperature, so "installed and done" rarely reaches the design-condition yield. We put monitoring, metering and operating strategy on one platform, so the system keeps approaching its best under real conditions.
- Heat output, supply and return water temperature and energy use metered online for collector and heat-pump systems.
- Operating mode and storage strategy adjusted on irradiance and load forecasts.
- Coordinated with the chiller plant and domestic hot water, instead of each running its own corner.
05 Proven / VRV
VRV / VRF systems
Multi-split savings are easy to overlook: coarse zoning, set-points that never change, operating data nobody can see. Centralised management plus strategy optimisation brings scattered indoor and outdoor units under control.
- Central monitoring and one start/stop strategy across multi-brand VRV systems.
- Set-points and operating modes adjusted to zone occupancy and outdoor conditions.
- Sub-metered energy, reported by floor or by tenant.
| Typical sites | Offices, chain stores, campus offices, projects with a limited retrofit budget |
|---|---|
| Product set | Box Optima + IoT gateway + Nexus Cloud |
| Access method | Brand gateway / protocol integration / wireless modules for extra points |
| Delivery focus | Metering and visibility first, strategy optimisation second |
06 Roadmap / NEXT
Scenarios we are moving into
One base supports every scenario, and the list keeps growing. A roadmap scenario starts with an efficiency diagnosis and a feasibility check, and only then is the retrofit decided.
07 Service / DELIVERY
From diagnosis to standing support,
three stages, three deliverables
SERVICE 01
Efficiency diagnosis
The portable kit goes in and collects 7–14 days of temperature, flow, pressure and power data, delivering an efficiency baseline, a saving-potential range and a retrofit list. Measure first; do not quote from experience.
SERVICE 02
System delivery
Design → hardware reinforcement → platform deployment → strategy commissioning → energy-saving test. The plant does not stop during the works, and manual fallback plus one-click rollback stay in place.
SERVICE 03
Standing operation
SaaS remote monitoring plus continuing expert tuning. Strategy iterates with season and load, savings are reviewed every period, and a one-off project becomes a continuing service.
We do not build equipment, we enable it: existing chillers, pumps and cooling towers all stay, and the efficiency gain comes from continuous optimisation at the control and strategy layer.
Which category is your site?
Send us the system layout, the process requirements and the last 12 months of operating data. We start with a quantified efficiency diagnosis, then talk about retrofits.